Most cloud cost advice starts with the obvious waste.
Find idle instances. Delete unattached storage. Rightsize oversized virtual machines. Improve your tags.
That work matters. But it is usually the easiest part of FinOps cost optimization.
The trickier costs often sit inside infrastructure that looks legitimate. The resources are active. The owners may be known. The spend might even be within budget.
Yet the way the environment is designed, allocated, or operated means you are paying more than the workload is worth.
A billing report can tell you what you spent. It may not tell you:
- Why the cost exists
- Whether the original reason still applies
- Which service or team is creating it
- What depends on the resource
- Whether changing it would introduce more risk than the saving justifies
This is why cost data needs architecture, ownership, usage, and change history around it.
Here are 5 cloud cost drains that can remain hidden even when your dashboards, reports, and tags appear to be working.
What Makes a Cloud Cost “Hidden”?
A hidden cloud cost doesn't have to be invisible on the bill.
The charge may be clearly listed but difficult to recognize as an optimization opportunity.
This often happens when the cost:
- Is spread across several services or accounts
- Sits under a valid product, project, or cost center
- Is created by relationships between resources
- Supports a real workload, but at an unnecessary level
- Was caused by an old architecture or commercial decision
- Is shared between teams, so nobody sees its full impact
- Looks discounted, even though it limits future choices
FinOps teams need to look beyond “What are we paying for?” and ask:
“Why are we still paying for it this way?”
The cost data starts the investigation. It does not finish it.
2. Migration Residue
Cloud migrations rarely happen in one clean step.
Teams often run old and new environments in parallel while they validate data, test performance, maintain rollback options, and move users gradually.
That overlap is sensible during the migration. The problem starts when temporary infrastructure becomes permanent.
Migration residue can include:
- Old load balancers and gateways
- Legacy databases or read replicas
- Duplicate storage and backups
- Snapshots created for rollback
- Temporary replication services
- Old monitoring and logging pipelines
- DNS records and reserved IP addresses
- VPNs and network connections
- Parallel security tooling
- Staging environments
- Migration accounts, projects, or subscriptions
- Licenses attached to the old platform
These resources may not look abandoned.
They can still receive occasional traffic, produce logs, hold retained data, or remain connected to the new environment. They may also carry valid tags from the migration project.
Why It Stays Hidden
A basic orphaned-resource check looks for infrastructure with no obvious connection or activity.
Migration residue often has both.
The original project team may have moved on, while nobody else owns the final cleanup. Teams may also keep old resources because they are not confident that every dependency has been removed.
The cost gradually becomes part of the new monthly baseline.
What to Inspect
Look for resources created or expanded around:
- Data center exits
- Cloud-to-cloud migrations
- Region moves
- Application modernization
- Container or Kubernetes adoption
- Database migrations
- Mergers and acquisitions
- Platform changes
Compare the current environment with the intended target architecture.
Then ask:
- Which resources belonged to the transition?
- Is traffic still reaching the old environment?
- When was the last meaningful read, write, or configuration change?
- Is the resource being kept for rollback, retention, or compliance?
- Who can approve its removal?
- Does it have a documented end date?
The Mistake to Avoid
Don't treat every old resource as safe to delete.
Some data may need to be retained. A rollback window may still be open. A low-traffic dependency may support a process that runs monthly or quarterly.
Decommissioning should follow validation, stakeholder approval, retention requirements, and a defined sequence.
The Decision to Make
Every migration should have a clear definition of “finished.”
That definition should cover:
- Target workloads validated
- Dependencies confirmed
- Rollback period closed
- Required data preserved
- Owners notified
- Old infrastructure removed
- Related contracts and licenses reviewed
- Documentation updated
Without those exit criteria, the business can end up paying indefinitely for both the journey and the destination.
3. Permanent Safety Margins
Cloud teams often provision extra capacity for good reasons.
They may be protecting a launch, preparing for seasonal demand, supporting a service-level objective, allowing for failover, or responding to an incident.
The problem isn't the safety margin itself.
The problem is that temporary caution often becomes permanent configuration.
Examples include:
- Kubernetes CPU and memory requests set far above actual needs
- Autoscaling minimums that are never reduced
- Node pools created for an old workload peak
- Database throughput provisioned for a previous usage pattern
- Extra replicas added during an incident
- Failover environments that exceed recovery requirements
- Development environments configured like production
- Performance buffers added before a launch and never reviewed
These resources are active and may show regular utilization. They will not always appear in a simple idle-resource report.
Why It Stays Hidden
Provisioned capacity reflects what the platform is prepared to support, not just what it is using now.
This is especially important in Kubernetes. Resource requests affect how workloads are scheduled and how much node capacity the cluster needs. Requests set far above real requirements can leave usable capacity stranded even when individual nodes appear busy.
Averages can also hide short but important peaks. A database running at 20% utilization for most of the day may still need its current capacity during a critical processing window.
What to Inspect
Review:
- CPU and memory requests against actual usage
- Kubernetes replica minimums and maximums
- Node-pool utilization and scheduling constraints
- Database throughput and connection patterns
- Autoscaling floors
- Failover and disaster-recovery capacity
- Non-production environments
- Capacity added during incidents or launches
- Average, peak, and percentile usage
Look at when the capacity was added and what problem it was intended to solve.
If nobody can explain why the margin exists, that is a useful finding in itself.
The Mistake to Avoid
Don't rightsize from average utilization alone.
Before reducing capacity, check:
- Peak and seasonal demand
- Batch-processing windows
- Failover requirements
- Startup and scaling times
- Service-level objectives
- Maintenance activity
- Known future demand
- Dependencies that could create sudden load
A low-utilization resource may still be correctly sized. A busy resource may still be inefficient.
The Decision to Make
Decide how much headroom each workload genuinely needs.
That decision should reflect the workload’s importance, demand pattern, recovery requirements, and tolerance for slower scaling.
It can help to define different policies for:
- Customer-facing production services
- Internal production services
- Batch workloads
- Development and test environments
- Disaster recovery
- Experimental workloads
Safety margins should be intentional, measurable, and reviewed. They shouldn't survive forever simply because removing them feels risky.
4. Shared Costs That Nobody Truly Owns
A cloud estate can be well-tagged and still allocate costs poorly.
Tags usually describe the resource that incurred the charge. They do not always explain which products, customers, or teams benefited from it.
That becomes a problem with shared services such as:
- Kubernetes clusters
- Central networking
- Logging and observability platforms
- Security tooling
- Shared databases
- Data platforms
- Backup services
- CI/CD infrastructure
- Platform engineering accounts
- Enterprise support
- Marketplace software
- Data transfer between teams’ services
These costs often sit with a platform or infrastructure team, even when many parts of the business create the demand.
Alternatively, the cost may be divided equally between departments. That is simple, but it can hide which services are driving consumption.
Why It Stays Hidden
The spending is technically allocated. It just is not allocated in a way that supports good decisions.
A product team may see its direct compute and storage costs while missing its share of the cluster, network, security, observability, and support costs needed to run the product.
This can distort:
- Product profitability
- Unit economics
- Forecasts
- Budgets
- Optimization priorities
- Architecture decisions
- Conversations between engineering and finance
It can also create weak incentives. A team has little reason to reduce logging volume or shared-cluster demand if those costs remain in somebody else’s budget.
What to Inspect
Separate cloud spending into:
- Direct costs
- Shared costs
- Unallocated costs
Then decide which shared costs should be distributed and which should remain central.
Possible allocation methods include:
- Actual usage
- Traffic
- Kubernetes resource requests
- Storage consumed
- Number of users or tenants
- Revenue
- Transactions
- Headcount
- A fixed percentage
- A combination of fixed and variable allocation
There is no single method that works for every shared service.
The right model is understandable, reasonably fair, and useful enough to influence decisions.
The Mistake to Avoid
Don't assume chargeback is always more mature than showback.
Showback lets teams see the costs they are responsible for while the spending remains in a central budget. Chargeback assigns those expenses to the relevant team or department.
Either approach can work. The right choice depends on your organization’s accounting model, culture, and goals.
It is often sensible to test an allocation method through showback before connecting it to formal budgets.
The Decision to Make
Ask what behavior the allocation model should encourage.
A useful model should help teams:
- Understand the full cost of their products and services
- See how their decisions affect shared platforms
- Compare cost with usage or business value
- Forecast more accurately
- Take responsibility for the costs they can influence
Tags remain useful, but tags alone rarely provide the full answer. Account structures, labels, resource relationships, derived metadata, cost centers, and usage data may all be needed.
5. Discounts Based on Yesterday’s Architecture
Commitment discounts can reduce the rate paid for stable cloud usage.
They can also create hidden cost when the commitment is based on an architecture that is already changing.
A purchase may have made sense when it was approved. Since then:
- Virtual machines may have moved to containers or serverless services
- Instances may have been rightsized
- Applications may have been retired
- Workloads may have changed region
- Demand may have become less predictable
- Teams may have moved to different services or instance families
- A migration may have accelerated
- The business may have reorganized or sold a product
The dashboard may still report healthy utilization or an attractive discount.
But another workload might now be consuming the commitment, hiding the fact that the original demand has disappeared. The organization may be saving against the on-demand rate while losing flexibility over what it runs next.
Why It Stays Hidden
Discount reports tend to focus on:
- Coverage
- Utilization
- Effective savings rate
- Commitment expiry
- On-demand usage
Those measures matter. But they don't always show whether the commitment still fits the organization’s direction.
For example, AWS Savings Plans exchange a lower rate for an hourly spending commitment over a 1-year or 3-year term. Unused hourly commitment cannot be carried into a later hour.
That makes forecasting important, but historical usage is only part of the forecast.
What to Inspect
Before buying or renewing a commitment, review:
- Stable baseline usage
- Application retirement plans
- Migration roadmaps
- Rightsizing work
- Region changes
- Modernization plans
- Seasonal demand
- Product growth or decline
- Existing commitments and expiry dates
- Which teams can influence the committed usage
After purchase, track both utilization and the business assumptions behind it.
The Mistake to Avoid
Don't buy commitments from trailing usage alone.
A recommendation based on the past may be mathematically sound while ignoring a planned architecture change.
The largest available discount isn't always the lowest-cost decision. A smaller commitment may produce a lower headline saving but preserve more room to modernize, migrate, or reduce demand.
The Decision to Make
Separate usage into:
- Demand expected to remain stable
- Demand likely to grow
- Demand likely to shrink
- Demand tied to a migration or product decision
- Demand that is too uncertain to commit
Then decide how much certainty you are willing to trade for a lower rate.
Staggering purchases and reviewing commitments regularly can reduce the risk of making one large decision based on a temporary workload pattern.
A Practical Workflow for Investigating Hidden Cloud Costs
These costs are difficult to find because they need context from several places.
A useful investigation usually follows this sequence.
1. Start With the Change
Look for a cost increase, architecture change, migration, capacity decision, or commercial commitment.
Do not limit the investigation to the service with the largest line item.
2. Connect the Cost to Real Resources
Identify the accounts, subscriptions, projects, clusters, services, and resources behind the spending.
Then examine their relationships.
3. Find the Owner and Original Intent
Ask who owns the service and why the current configuration exists.
A decision can look wasteful until you understand the availability, performance, security, or compliance requirement behind it.
4. Decide Whether the Cost Is Temporary or Structural
Temporary costs may be justified during a migration, launch, incident, or seasonal peak.
Structural costs deserve a longer-term design or commercial decision.
5. Model the Trade-Off
Estimate:
- Potential saving
- Engineering effort
- Operational risk
- Performance impact
- Resilience impact
- Contract implications
- Time needed to make the change
6. Assign and Track the Action
A recommendation has little value when it sits in a dashboard without an owner.
Route the finding to the right team, record the decision, and check whether the expected saving appears after the change.
How Hyperglance Adds Context to Cloud Cost Optimization
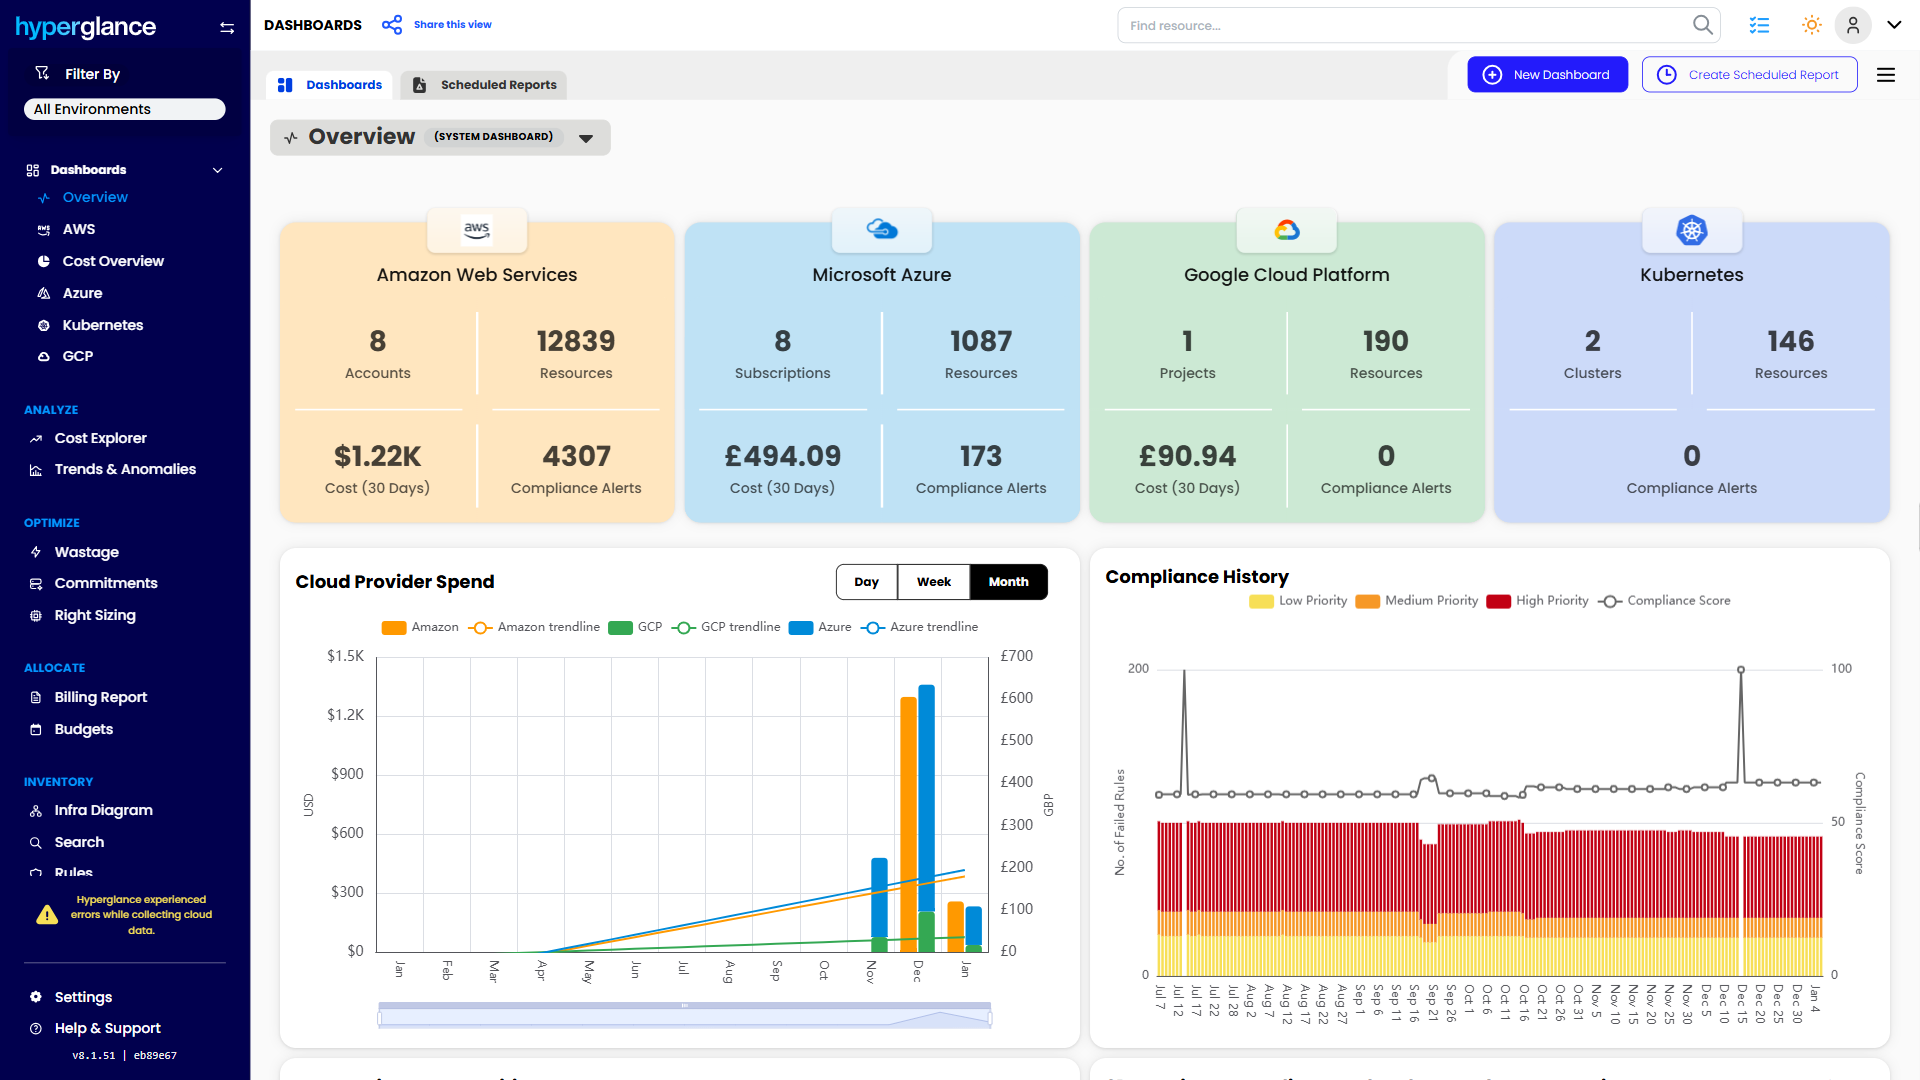
Hyperglance helps teams investigate cloud costs across AWS, Azure, Google Cloud, and Kubernetes.
Rather than looking at cost data alone, you can connect spending to resources, ownership, architecture, and related governance information.
This can help you:
- Explore cloud costs and trends
- See the resources behind the spending
- Visualize infrastructure and resource relationships
- Find unused and underused resources
- Investigate cost anomalies
- Review rightsizing and commitment opportunities
- Group and report costs using tags
- Normalize inconsistent tagging
- Route findings through Jira, ServiceNow, Slack, and Microsoft Teams
- Automate approved actions through defined rules
Hyperglance is self-hosted, giving teams more control over deployment and data handling when cloud information cannot sit in another SaaS platform.
The aim isn't to turn every recommendation into an automatic deletion.
It is to give FinOps, engineering, platform, and cloud operations teams enough context to decide what can safely change.
Find the Costs That Don't Look Like Waste
The easiest cloud waste to find is often the least controversial.
An unattached disk has no active dependency. An expired test environment has no reason to remain online.
The bigger decisions are rarely that neat.
A network path may be expensive but important for resilience. Extra capacity may protect a critical workload. A shared platform may be efficient overall while distributing cost unfairly. A commitment may provide a good discount while restricting a planned migration.
Strong FinOps cost optimization does not chase every possible saving.
It helps teams understand what they are paying for, why it costs that much, and whether the current trade-off still makes sense.
See how Hyperglance connects cloud costs to resources, ownership, and architecture context.
Book your demo today.
FAQs
What Are Hidden Cloud Costs?
Hidden cloud costs are charges that appear in billing data but are difficult to recognize as optimization opportunities. They may be spread across services, created by architecture relationships, allocated to shared platforms, or tied to decisions that are no longer current.
Why Don’t Standard Cloud Reports Find All Waste?
Billing and optimization reports work with the data and signals available to them. They may identify low utilization, idle resources, or pricing opportunities, but they do not always understand business intent, architecture dependencies, migration history, ownership, or future plans.
Is Every Underused Cloud Resource Waste?
No. Low utilization is a reason to investigate, not proof that a resource should be reduced or removed. The resource may support peak demand, failover, batch processing, recovery, or an important low-volume service.
How Often Should Teams Review Hidden Cloud Costs?
The right frequency depends on how quickly the environment changes. Fast-moving estates may need weekly or monthly checks, while slower environments may use quarterly architecture and commercial reviews. Migration resources, temporary capacity, and commitments should also have their own review dates.
What Is the Difference Between Showback and Chargeback?
Showback reports cloud costs to the teams responsible for them while the expenses remain in a central budget. Chargeback assigns the expenses to those teams or departments. Neither approach is automatically better. The right choice depends on the organization.
How Does Architecture Context Improve FinOps Decisions?
Architecture context shows what a resource supports, what it connects to, and what may be affected by a change. This helps teams distinguish safe savings opportunities from infrastructure that is quiet, shared, or expensive for a valid reason.
Why Teams Choose Hyperglance in 2026
Hyperglance is a strong fit when cost data alone doesn’t give your team enough context.
That often happens when teams are asking questions like:
- What is running across our cloud estate?
- Who owns this resource?
- Why did this cost change?
- What else depends on it?
- Is it safe to clean up?
- Which policy, security, or compliance issue needs attention?
- Can we route this to the right owner or trigger an approved action?
We help teams connect cloud cost to infrastructure context across AWS, Azure, Google Cloud, and Kubernetes. That means FinOps, CloudOps, platform, security, and leadership teams can work from the same view.
Hyperglance is especially useful for mid-market, enterprise, MSP, public sector, and regulated teams where ownership, governance, automation, and data control matter.
What You Can Do With Hyperglance
- See cost, resources, relationships, and ownership in one place
- Visualize cloud architecture with interactive diagrams
- Find waste, policy issues, and cost anomalies faster
- Route findings to the right team through existing workflows
- Use no-code automation for approved fixes
- Run Hyperglance in your own environment when data control matters
Want to see where Hyperglance fits in your FinOps stack?
Explore the product, start a free trial, or book a demo with the team.

About The Author: Stephen Lucas
As Hyperglance's Chief Product Officer (CPO), Stephen is responsible for the Hyperglance product roadmap. Stephen has over 20 years of experience in product management, project management, and cloud strategy across various industries.